Matlab SCPI reference
On this page you will learn how to send SCPI-commands to a Bode device using the tool Matlab.
Preconditions
National Instruments' NI-VISA is installed on the client device (e.g. PC). For the examples shown on this page the Matlab Instrument Control Toolbox is required. The SCPI-Server of the Bode is up and running and the IP-address as well as port are known.
Important
Visa has only been included in Matlab 2021 and higher. In Addition: If you want to read many data from the device, you need to configure the Java Memory Heap
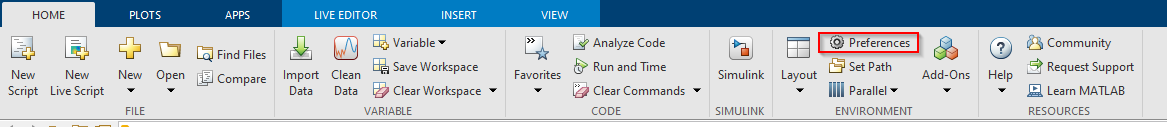
To do that, in Matlabs Home tab click on Preferences
Find Java Heap Memory
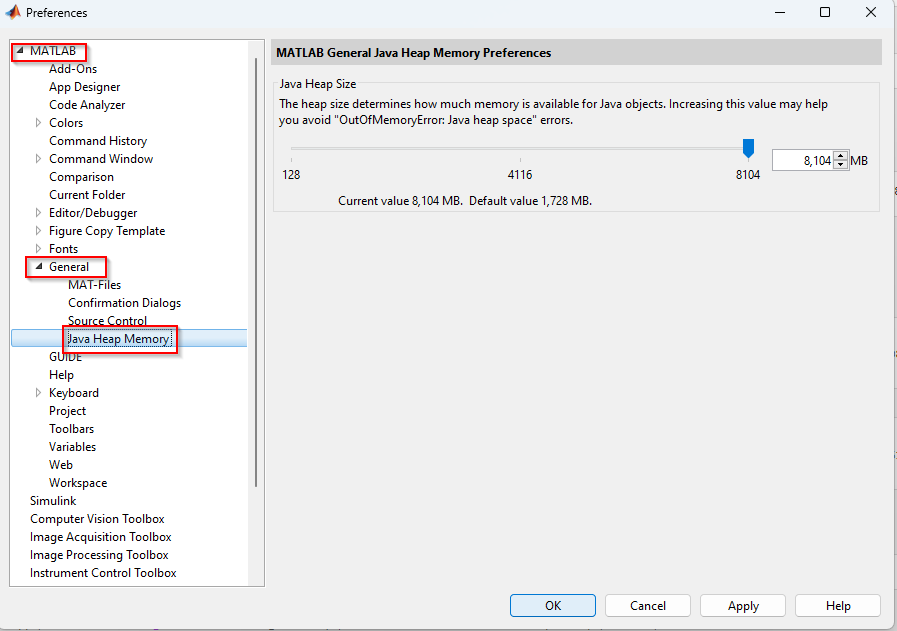
Set it according to your wishes and apply the changes.
Matlab needs to be restarted in order for the changes to take effect.
Connecting to the Server
Note
The resource name consists of the SCPI-Server-IP and the port in the following form unless modified
The default port is 5025 for all Bode devices
With only one line of code you can connect to the SCPI Server
vi = visadev(resourceName);
However, set the termination character and the timeout.
configureTerminator(vi, 'LF'); %Termchar = '\n'
vi.Timeout = 4;
Sending queries and reading responses
When sending a command without an expected response use the writeline() function.
writeline(vi, '*RST');
When querying a command and wanting to read the response use the writeread() function.
response = writeread(vi, '*IDN?');
Estimating Measurement duration
Important
If you want many measurement points, the measurement is going to take longer. Therefore, you might need to reconfigure the timeout as shown above to ensure the measurement is finished, before a timeout occurs.
The timeout needs to be longer than the duration of the measurement. You can calculate how long the measurement is going to take with this simple query
time = querycommand(instrument, ":SENS:SWE:TIME?");
disp("Time needed for the Measurement: " + time + "seconds")
This will give you an estimation on the duration and you can configure the timeout value according to this result.
Note
Calculate the duration of the measurement only after configuring the sweep settings.
Terminate
After communication is finished delete the Visa object.
clear vi;
Keep in mind that if running your script has failed, you need to clear the visa object via Matlabs Command Window because it won't let you create another instance of the same device.
Example connection test
Here is an example on how to test your connection to the SCPI-Server and reset it on any Bode.
resourceName = 'TCPIP0::172.22.44.19::5025::SOCKET';

vi = visadev(resourceName);
configureTerminator(vi, 'LF'); %Termchar = '\n'
vi.Timeout = 4; %timeout in seconds

writeline(vi, '*RST');

response = writeread(vi, '*IDN?');
disp(response)

clear vi;
Example Sweep Measurement
Here is an example on how to perform a sweep measurement.
clear all;
resourceName = 'TCPIP0::172.22.44.19::5025::SOCKET';

tic;
disp('Trying to connect to Visa resource: ' + resourceName);
%Open a session
vi = visadev(resourceName);
configureTerminator(vi, 'LF'); %Termchar = '\n'
vi.Timeout = 4; %in seconds

%Get SCPI Sever id
id = writeread(vi, '*IDN?');
disp('SCPI client connected to SCPI Server: ' + id)
%Trying to lock the Bode device
lockOK = writeread(vi,  ':SYST:LOCK:REQ?');
disp('Locking status: ' + lockOK);
%enable error checking for oversight
writeline(vi, '*ESE 255');
error = writeread(vi, ':SYST:ERR?');
disp('After locking: ' + error);
%Configuring Measurement
writeline(vi, ':CALC:PAR:DEF Z'); %one port  impedance measurement
writeline(vi, ':SENS:FREQ:STAR 10kHz'); %start frequency 10kHz
writeline(vi, ':SENS:FREQ:STOP 10MAHz'); % stop frequency 10MHz
writeline(vi, ':SENS:SWE:POIN 20'); %20 measurement points
writeline(vi, ':SENS:SWE:TYPE LOG'); %logarithmic sweep
writeline(vi, ':SENS:BAND 300Hz');
error = writeread(vi, ':SYST:ERR?'); %check for errors after sweep config
disp('After freq definition: ' + error);

writeline(vi, ':CALC:FORM SLIN'); %linear magnitude and phase
writeline(vi, ':TRIG:SOUR BUS'); % Bus as trigger source
writeline(vi, ':INIT:CONT ON'); %initialize the trigger
writeline(vi, ':TRIG:SING'); %trigger a single measurement
error = writeread(vi, ':SYST:ERR?');% check for errors after trig config
disp('After trig config: ' + error);
opc = writeread(vi, '*OPC?'); %wait for all operations to finish
disp('Operation finished status: ' + opc);
%Get the frequency points
freqValues = writeread(vi, ':SENS:FREQ:DATA?');
disp(freqValues);
error = writeread(vi, ':SYST:ERR?'); %check for errors after reading frequencies
disp('After reading freqs: ' + error);
pause(2); %delay to read all frequencies
%Get the measurement data
allResults = writeread(vi, ':CALC:DATA:SDAT?');
disp(allResults);
%Convert the data into readable arrays
allResults_list_raw = str2double(strsplit(allResults, ','));
freq = str2double(strsplit(freqValues, ','));

magnitude = allResults_list_raw(1:20) %Change according to amont of measurement points
phase = allResults_list_raw(21:end) % same here
%Trying to release the Bode device
relOk = writeread(vi, ':SYST:LOCK:REL?');
disp('Release status: ' + relOk);
%Example print of first measurement point
disp('Frequency: ' + freq(1) + 'Hz ' + 'Magnitude: ' + magnitude(1) + ' Ohms ' +
'Phase: ' + phase(1) + '°');
measurement_duration = toc;
disp('Measurement complete. Took ' + measurement_duration + 'seconds.')
clear vi;
To directly output a Bode plot use something like this:
figure;
subplot(2, 1, 1);
semilogx(freq, magnitude, '-o');
title('Bode Plot');
ylabel('Magnitude (Ohms)');
grid on;
subplot(2,1,2);
semilogx(freq, phase, '-x');
xlabel('Frequency (Hz)');
ylabel('Phase (°)');
grid on;
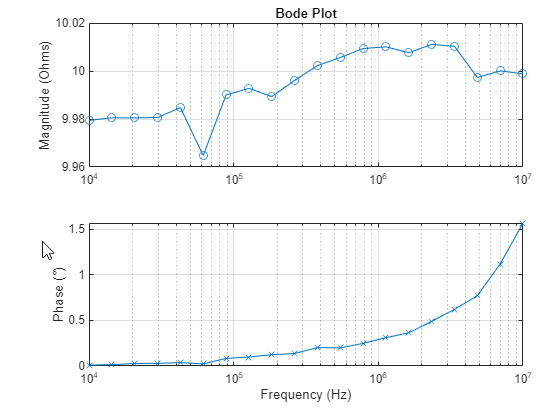
Using this particular style the Bode plot will look like this:
Note
The Measurement resulting in this plot was performed with a 10 Ohms resistor attached.
Communicate with Bode using TCP
If you don't have the Instrument Control Toolbox, you can still send SCPI commands to your Bode device using tcpclient
For more information on how to use the TCP client please refer to the Octave SCPI documentation section.
Here is an example on how to perform the same measurement as above without having bought the Instrument Control Toolbox
Note
Because this doesn't use Visa the communication can't be observed with NI I/O-Trace. We suggest using Wireshark to observe the TCP communication.
Server_IP = '172.22.44.19'
disp("Trying to connect to Server: " + Server_IP);
tic;
%Open TCP connection
t0 = tcpclient(Server_IP, 5025);
configureTerminator(t0, 'LF');

%Get the SCPI Server id
response = writeread(t0, "*IDN?");
disp("SCPI client connected to SCPI Server: " + response);
clear response;

%Trying to lock the Bode device
response  = writeread(t0, ":SYST:LOCK:REQ?");
disp("Locking status: " + response);
clear response;

%Resets
writeline(t0, "*CLS");
writeline(t0, "*RST");
writeline(t0, "*ESE 255"); %enable errorchecks

%check for errors after reset
response = writeread(t0, ":SYST:ERR?");
disp("After reset: " + response);
clear response;

%Sweep config
writeline(t0, ":SENS:FREQ:STAR: 10kHz"); %start freq = 10kHz
writeline(t0, ":SENS:FREQ:STOP 10MAHz"); %stop freq = 10MAHz
writeline(t0, ":SENS:SWE:POIN 20"); %Measurement points = 20
writeline(t0, ":SENS:SWE:TYPE LOG"); %logarithmic sweep
writeline(t0, ":SENS:BAND 300Hz"); %receiver bandwidth = 300Hz

%check for errors after sweep config
response = writeread(t0, ":SYST:ERR?");
disp("After sweep config: " + response);
clear response;

%trigger config
writeline(t0, ":CALC:PAR:DEF Z"); %one-port impedance measurement
writeline(t0, ":CALC:FORM SLIN"); %linear magnitude and phase
writeline(t0, ":TRIG:SOUR BUS"); %Bus is trigger source
writeline(t0, ":INIT:CONT ON"); %initialize the trigger
writeline(t0, ":TRIG:SING"); % trigger single measurement

%check for errors after trig config
response = writeread(t0, ":SYST:ERR?");
disp("After trig config: " + response);
clear response;

%Wait until all operations are finished
response = writeread(t0, "*OPC?");
disp("Operations finished status: " + response);
clear response;

%get the frequency points
freq = writeread(t0, ":SENS:FREQ:DATA?");
disp("frequencies: " + freq);
clear response;

%get the measurement data
results = writeread(t0, ":CALC:DATA:SDAT?");
disp("results: " + results);
clear response;

%Release the Bode device
response = writeread(t0, ":SYST:LOCK:REL?");
disp("release stauts: " + response);
clear response;

duration = toc;

%Convert data into readable arrays
freqlist = str2double(strsplit(freq, ','));

allResults_list_raw = str2double(strsplit(results, ','));
magnitude = allResults_list_raw(1:20); % change this according to your measurement points
phase = allResults_list_raw(21:end); % same here

%Example print the first measurement point
disp("Frequency: " + freqlist(1) + "Hz " + "Magnitude: " + magnitude(1) + " Ohms " +
"Phase: " + phase(1) + "°");

disp("Measurement complete. Took " + duration + "seconds.")
clear t0;
Using Visa without the Toolbox
There is the possibility of implementing any .NET assembly in Matlab and so using Visa without the Instrument Control Toolbox.
To add a DLL use the NET.addAssembly() function.
asm = NET.addAssembly('global Assembly Name or DLL-path');
By adding the Ivi.Visa assembly you can use all relevant Visa features in Matlab without buying the Instrument Control Toolbox.
The DLL should be added to the GAC with the installation of NI-Visa.
Example Connection Test
asml = NET.addAssembly('Ivi.Visa'); %Adding the Ivi.Visa.dll to use Visa in Matlab
%If 'Ivi.Visa' does not work copy the path from the GAC

resourceName = 'TCPIP::172.22.45.171::5025::SOCKET';
tic;
disp("Trying to connect to Visa resource: " + resourceName);
%Opening a visa Session
%Setting the termination character to \n, which is 10 in ASCII code
%Enabling the termination character
instrument = Ivi.Visa.GlobalResourceManager.Open(resourceName);
instrument.TerminationCharacterEnabled = 1;
instrument.TerminationCharacter = 10; % \n = 10 ASCII
instrument.TimeoutMilliseconds = 2000;
instrument.IOProtocol = Ivi.Visa.IOProtocol.Ieee4882;
instrument.SendEndEnabled = true;

%Getting the ID of the Bode device
id = querycommand(instrument, "*IDN?");
disp("SCPI client connected to SCPI resource: " + id);

%function to write commands
function writecommand(vi, command)
    vi.RawIO.Write(command + newline);
end

% This function sends a command to the Visa instrument
% Reads the response in a loop until the termination character (\n) is read
% There is no need to set the buffer size if the response
% exceeds the default buffer size.
function response = querycommand(vi, command)
    writecommand(vi, command)
    list = {};
    currentChars = '';

    while ~contains(currentChars, newline)
        try
            currentChars = char(vi.RawIO.ReadString());
            list{end+1} = currentChars;
        catch exception
            disp("Exception occurred in the 'response' funtion " + getReport(exception,'extended','hyperlinks','off'))
        end
    end
    response = strjoin(list, '');
end
Example Sweep Measurement
In the following example the same measurement as already seen above, is performed with the functions provided by the Visa DLL.
Important
Always use the "" characters for strings when using multiple inputs. In the following functions a newline gets appended when sending commands. Therefore "" must be used for every command.
asm1 = NET.addAssembly('Ivi.Visa'); %Adding the Ivi.Visa.dll to use Visa in Matlab
%If 'Ivi.Visa' does not work copy the path from the GAC

resourceName = 'TCPIP::172.22.45.171::5025::SOCKET';
tic;
disp("Trying to connect to Visa resource: " + resourceName);
%Opening a visa Session
%Setting the termination character to \n, which is 10 in ASCII code
%Enabling the termination character
instrument = Ivi.Visa.GlobalResourceManager.Open(resourceName);
instrument.TerminationCharacterEnabled = 1;
instrument.TerminationCharacter = 10; % \n = 10 ASCII
instrument.TimeoutMilliseconds = 2000;
instrument.IOProtocol = Ivi.Visa.IOProtocol.Ieee4882;
instrument.SendEndEnabled = true;

%Getting the ID of the Bode device
id = querycommand(instrument, "*IDN?");
disp("SCPI client connected to SCPI resource: " + id);
%Trying to lock the Bode device
lockOK = querycommand(instrument, "SYST:LOCK:REQ?");
disp("Locking status: " + lockOK);
%Resetting
writecommand(instrument, "*CLS");
writecommand(instrument, "*RST");
writecommand(instrument, "*ESE 255"); %Enabling error-checks

%Checking for Errors after the resets
error = querycommand(instrument, ":SYST:ERR?");
disp("After resets: " + error);
clear error;

%Configuring the sweep
%Change according to your needs
writecommand(instrument, "SENS:FREQ:STAR 10kHz"); %Start frequency
writecommand(instrument, "SENS:FREQ:STOP 10MAHz"); %Stop frequency
writecommand(instrument, "SENS:SWE:POIN 201"); %Measuring points
writecommand(instrument, "SENS:SWE:TYPE LOG"); %Logarithmic sweep
writecommand(instrument, "SENS:BAND 300Hz"); %receiver bandwidth
%Checking for Errors after the sweep config
error = querycommand(instrument, ":SYST:ERR?");
disp("After sweep config: " + error);
time = querycommand(instrument, ":SENS:SWE:TIME?");
disp("Time needed for the Measurement: " + time + "seconds")

clear error;

%Configuring the trigger
writecommand(instrument, ":CALC:PAR:DEF Z"); %Single-port impedance measurement
writecommand(instrument, ":CALC:FORM SLIN"); %Linear magnitude and phase
writecommand(instrument, ":TRIG:SOUR BUS"); %Use bus as trigger source
writecommand(instrument, ":INIT:CONT ON"); %Initialize the trigger
writecommand(instrument, ":TRIG:SING"); %trigger a single sweep

%Checking for errors after the trig config
error = querycommand(instrument, ":SYST:ERR?");
disp("After trig config: " + error);
clear error;

%Waiting for all operations to finish
opc = querycommand(instrument, "*OPC?");
disp("Operations finished status: " + opc);
%Read the frequency points
freqlist = querycommand(instrument, ":SENS:FREQ:DATA?");
disp("frequencies: " + freqlist);
%Get the measurement data
allresults = querycommand(instrument, ":CALC:DATA:SDAT?");
disp("results: " + allresults);
%Convert the data into readable arrays
allResults_list_raw = str2double(strsplit(allresults, ','));
freq = str2double(strsplit(freqlist, ','));

magnitude = allResults_list_raw(1:201) %adjust according to measurement points
phase = allResults_list_raw(202:end) %adjust according to measurement points
%Trying to release the Bode device
relOK = querycommand(instrument, ":SYST:LOCK:REL?");
disp("Release status: " + relOK);
%Example: print the result of the first measurement point
disp("Frequency: " + freq(1) + "Hz " + "Magnitude: " + magnitude(1) + " Ohms " + "Phase: " + phase(1) + "°");
measurement_duration = toc;
disp("Measurement complete. Took " + measurement_duration + "seconds.")
%Plot the results
figure;
subplot(2, 1, 1);
semilogx(freq, magnitude, '-o');
title('Bode Plot');
ylabel('Magnitude (Ohms)');
grid on;
subplot(2,1,2);
semilogx(freq, phase, '-x');
xlabel('Frequency (Hz)');
ylabel('Phase (°)');
grid on;
%Close the Visa session
clear instrument;

%function to write commands
function writecommand(vi, command)
    vi.RawIO.Write(command + newline);
end

% This function sends a command to the Visa instrument
% Reads the response in a loop until the termination character (\n) is read
% There is no need to set the buffer size if the response
% exceeds the default buffer size.
function response = querycommand(vi, command)
    writecommand(vi, command)
    list = {};
    currentChars = '';

    while ~contains(currentChars, newline)
        try
            currentChars = char(vi.RawIO.ReadString());
            list{end+1} = currentChars;
        catch exception
            disp("Exception occurred in the 'response' funtion " + getReport(exception,'extended','hyperlinks','off'))
        end
    end

    response = strjoin(list, '');
end
Important
If required move the functions into different files, Matlab doesn't allow functions in the same file as the program.
Note
There is the possibility to set the read-buffer size in ReadString().
When measuring with an 10 Ohms resistor attached the plots will look something like the following: